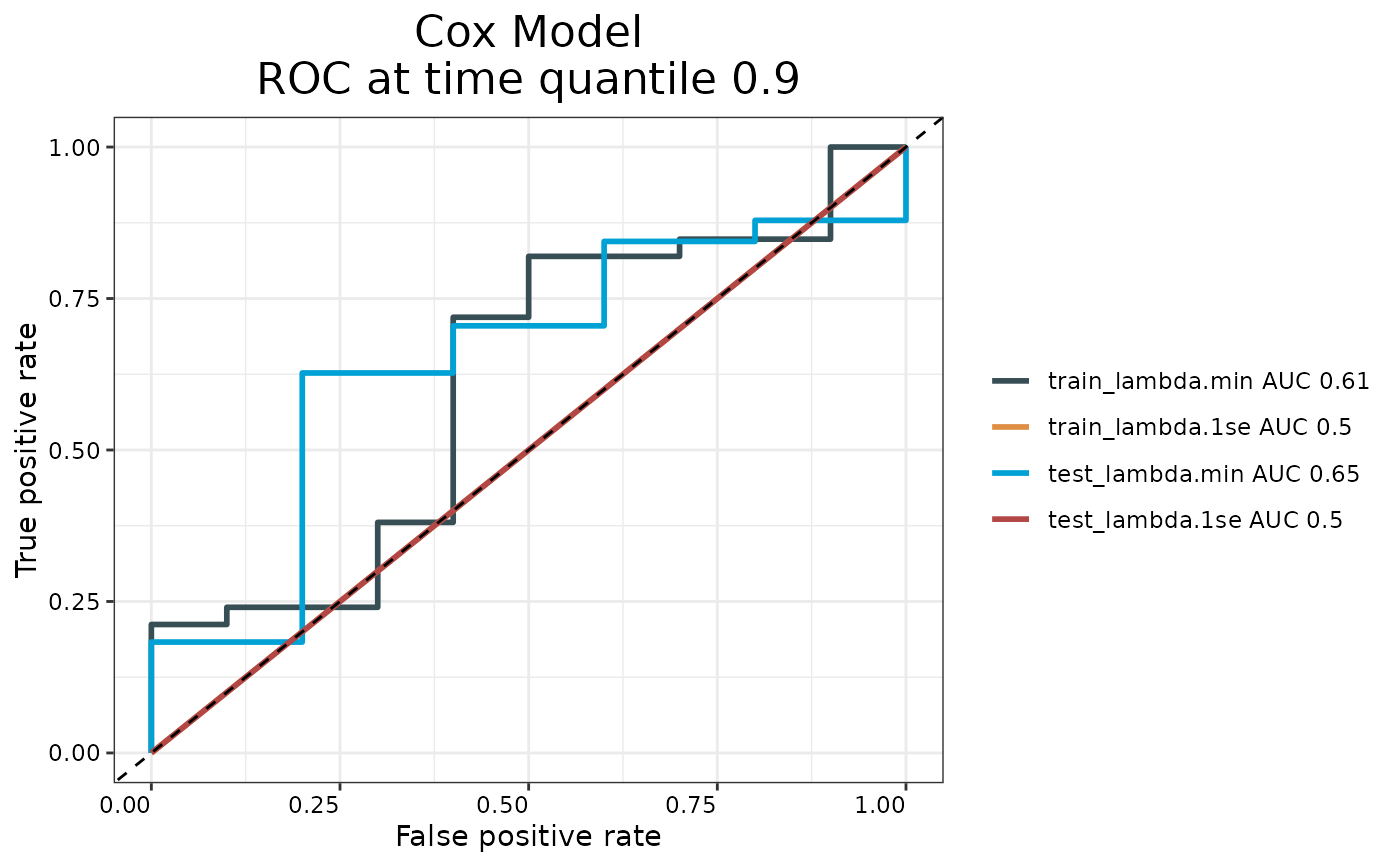
Generates time-dependent ROC curves for evaluating prognostic accuracy of survival models. Plots training and testing ROC curves at the 90th percentile survival time.
Usage
PlotTimeROC(
  train.x,
  train.y,
  test.x,
  test.y,
  model,
  modelname,
  cols = NULL,
  palette = "jama"
)
Arguments
- train.x
Matrix or data frame of training predictors.
- train.y
Training survival outcomes (time and status).
- test.x
Matrix or data frame of testing predictors.
- test.y
Testing survival outcomes (time and status).
- model
Fitted survival model object.
- modelname
Character string for model identification.
- cols
Optional vector of colors for plotting.
- palette
Character string specifying color palette. Default is `"jama"`.
Examples
if (requireNamespace("glmnet", quietly = TRUE) &&
  requireNamespace("survival", quietly = TRUE) &&
  requireNamespace("timeROC", quietly = TRUE)) {
  library(survival)
  set.seed(123)
  train_x <- matrix(rnorm(100 * 5), ncol = 5)
  train_y <- data.frame(time = rexp(100), status = rbinom(100, 1, 0.5))
  test_x <- matrix(rnorm(50 * 5), ncol = 5)
  test_y <- data.frame(time = rexp(50), status = rbinom(50, 1, 0.5))
  fit <- glmnet::cv.glmnet(train_x, Surv(train_y$time, train_y$status), family = "cox")
  p <- PlotTimeROC(train_x, train_y, test_x, test_y, fit, "Cox Model")
  print(p)
}
#> Warning: Starting in glmnet 5.1, the default Cox tie-handling method will change from 'breslow' to 'efron' (matching survival::coxph). To silence this message and lock in the v5.0 default, pass cox.ties = 'breslow' explicitly. To preview the v5.1 behavior, pass cox.ties = 'efron'.
#> Warning: Starting in glmnet 5.1, the default Cox tie-handling method will change from 'breslow' to 'efron' (matching survival::coxph). To silence this message and lock in the v5.0 default, pass cox.ties = 'breslow' explicitly. To preview the v5.1 behavior, pass cox.ties = 'efron'.
#> Warning: Starting in glmnet 5.1, the default Cox tie-handling method will change from 'breslow' to 'efron' (matching survival::coxph). To silence this message and lock in the v5.0 default, pass cox.ties = 'breslow' explicitly. To preview the v5.1 behavior, pass cox.ties = 'efron'.
#> Warning: Starting in glmnet 5.1, the default Cox tie-handling method will change from 'breslow' to 'efron' (matching survival::coxph). To silence this message and lock in the v5.0 default, pass cox.ties = 'breslow' explicitly. To preview the v5.1 behavior, pass cox.ties = 'efron'.
#> Warning: Starting in glmnet 5.1, the default Cox tie-handling method will change from 'breslow' to 'efron' (matching survival::coxph). To silence this message and lock in the v5.0 default, pass cox.ties = 'breslow' explicitly. To preview the v5.1 behavior, pass cox.ties = 'efron'.
#> Warning: Starting in glmnet 5.1, the default Cox tie-handling method will change from 'breslow' to 'efron' (matching survival::coxph). To silence this message and lock in the v5.0 default, pass cox.ties = 'breslow' explicitly. To preview the v5.1 behavior, pass cox.ties = 'efron'.
#> Warning: Starting in glmnet 5.1, the default Cox tie-handling method will change from 'breslow' to 'efron' (matching survival::coxph). To silence this message and lock in the v5.0 default, pass cox.ties = 'breslow' explicitly. To preview the v5.1 behavior, pass cox.ties = 'efron'.
#> Warning: Starting in glmnet 5.1, the default Cox tie-handling method will change from 'breslow' to 'efron' (matching survival::coxph). To silence this message and lock in the v5.0 default, pass cox.ties = 'breslow' explicitly. To preview the v5.1 behavior, pass cox.ties = 'efron'.
#> Warning: Starting in glmnet 5.1, the default Cox tie-handling method will change from 'breslow' to 'efron' (matching survival::coxph). To silence this message and lock in the v5.0 default, pass cox.ties = 'breslow' explicitly. To preview the v5.1 behavior, pass cox.ties = 'efron'.
#> Warning: Starting in glmnet 5.1, the default Cox tie-handling method will change from 'breslow' to 'efron' (matching survival::coxph). To silence this message and lock in the v5.0 default, pass cox.ties = 'breslow' explicitly. To preview the v5.1 behavior, pass cox.ties = 'efron'.
#> Warning: Starting in glmnet 5.1, the default Cox tie-handling method will change from 'breslow' to 'efron' (matching survival::coxph). To silence this message and lock in the v5.0 default, pass cox.ties = 'breslow' explicitly. To preview the v5.1 behavior, pass cox.ties = 'efron'.