Calculates and visualizes the correlation between two variables with options for scaling, handling missing values, and incorporating grouping data.
Usage
get_cor(
  eset,
  pdata = NULL,
  var1,
  var2,
  is.matrix = FALSE,
  id_eset = "ID",
  id_pdata = "ID",
  scale = TRUE,
  subtype = NULL,
  na.subtype.rm = FALSE,
  color_subtype = NULL,
  palette = "jama",
  index = NULL,
  method = c("spearman", "pearson", "kendall"),
  show_cor_result = TRUE,
  col_line = NULL,
  id = NULL,
  show_label = FALSE,
  point_size = 4,
  title = NULL,
  alpha = 0.5,
  title_size = 1.5,
  text_size = 10,
  axis_angle = 0,
  hjust = 0,
  show_plot = TRUE,
  save_plot = FALSE,
  path = NULL,
  fig.format = "png",
  fig.width = 7,
  fig.height = 7.3,
  add.hdr.line = FALSE
)
Arguments
- eset
Dataset containing the variables (data frame or matrix).
- pdata
Optional phenotype data frame. Default is `NULL`.
- var1
Name of the first variable.
- var2
Name of the second variable.
- is.matrix
Logical indicating if `eset` is a matrix with features as rows. Default is `FALSE`.
- id_eset
ID column in `eset`. Default is `"ID"`.
- id_pdata
ID column in `pdata`. Default is `"ID"`.
- scale
Logical indicating whether to scale data. Default is `TRUE`.
- subtype
Optional grouping variable for coloring points. Default is `NULL`.
- na.subtype.rm
Logical indicating whether to remove NA in subtype. Default is `FALSE`.
- color_subtype
Colors for subtypes. Default is `NULL`.
- palette
Color palette name. Default is `"jama"`.
- index
Plot index for filename. Default is `NULL` (uses 1).
- method
Correlation method: `"spearman"`, `"pearson"`, or `"kendall"`. Default is `"spearman"`.
- show_cor_result
Logical indicating whether to print correlation result. Default is `TRUE`.
- col_line
Color of regression line. Default is `NULL` (auto-determine).
- id
Column for point labels. Default is `NULL`.
- show_label
Logical indicating whether to show labels. Default is `FALSE`.
- point_size
Size of points. Default is 4.
- title
Plot title. Default is `NULL`.
- alpha
Transparency of points. Default is 0.5.
- title_size
Title font size. Default is 1.5.
- text_size
Text font size. Default is 10.
- axis_angle
Axis label angle. Default is 0.
- hjust
Horizontal justification. Default is 0.
- show_plot
Logical indicating whether to display plot. Default is `TRUE`.
- save_plot
Logical indicating whether to save plot. Default is `FALSE`.
- path
Save path. Default is `NULL`.
- fig.format
Figure format: `"png"` or `"pdf"`. Default is `"png"`.
- fig.width
Figure width in inches. Default is 7.
- fig.height
Figure height in inches. Default is 7.3.
- add.hdr.line
Logical for adding HDR (high density region) lines. Default is `FALSE`.
Examples
# Simulate data
set.seed(123)
sim_eset <- matrix(rnorm(100 * 20), 100, 20)
rownames(sim_eset) <- c("GZMB", "CD274", paste0("Gene", 3:100))
colnames(sim_eset) <- paste0("Sample", 1:20)
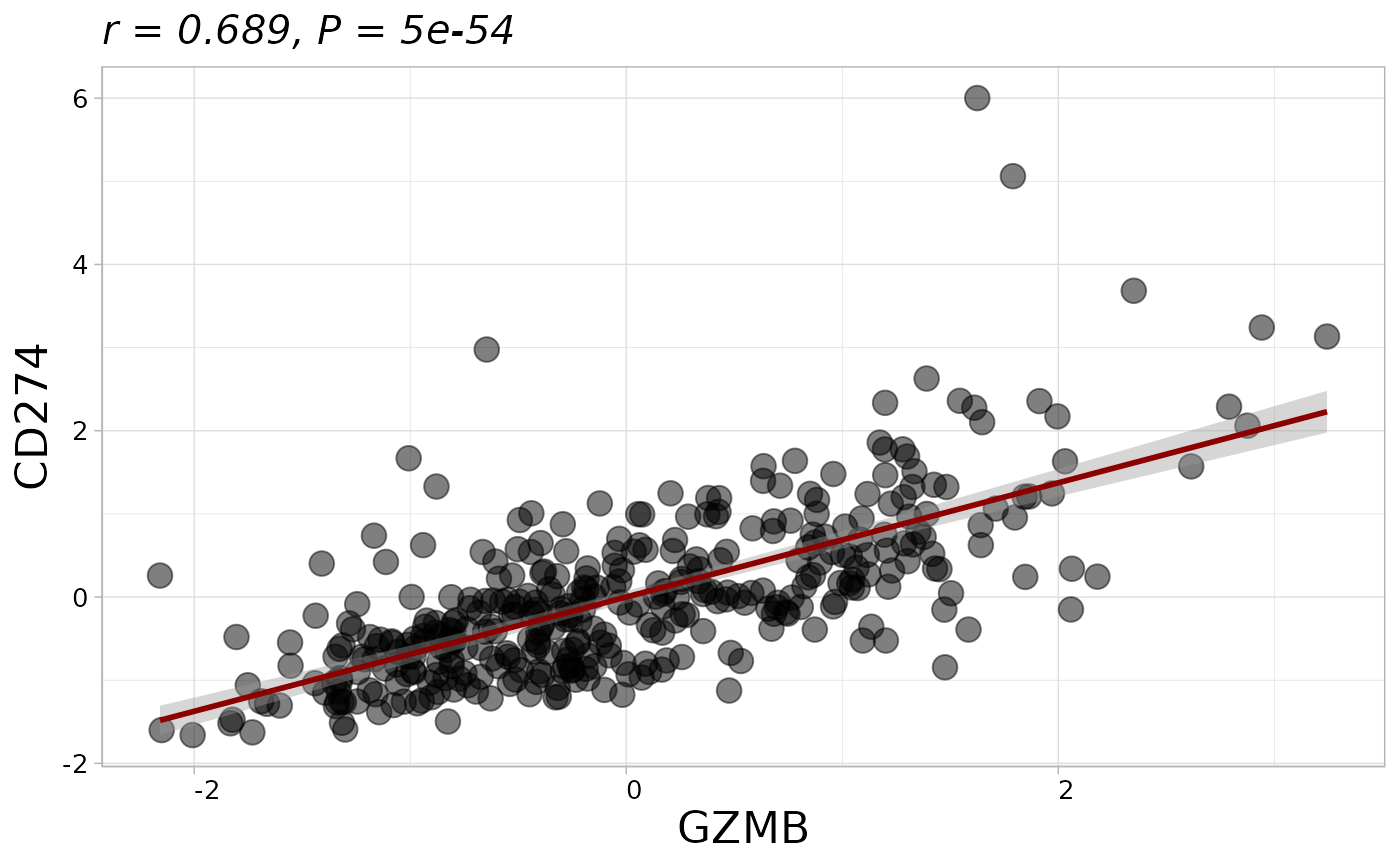
# Calculate and plot correlation
p <- get_cor(eset = sim_eset, is.matrix = TRUE, var1 = "GZMB", var2 = "CD274", show_plot = FALSE)
#> ℹ Calculating spearman correlation (n = 20)
#>
#> Spearman's rank correlation rho
#>
#> data: data[[var1]] and data[[var2]]
#> S = 782, p-value = 0.07226
#> alternative hypothesis: true rho is not equal to 0
#> sample estimates:
#> rho
#> 0.4120301
#>
#> ℹ Exact p-value: 7.1e-02
if (!is.null(p)) print(p)
#> `geom_smooth()` using formula = 'y ~ x'