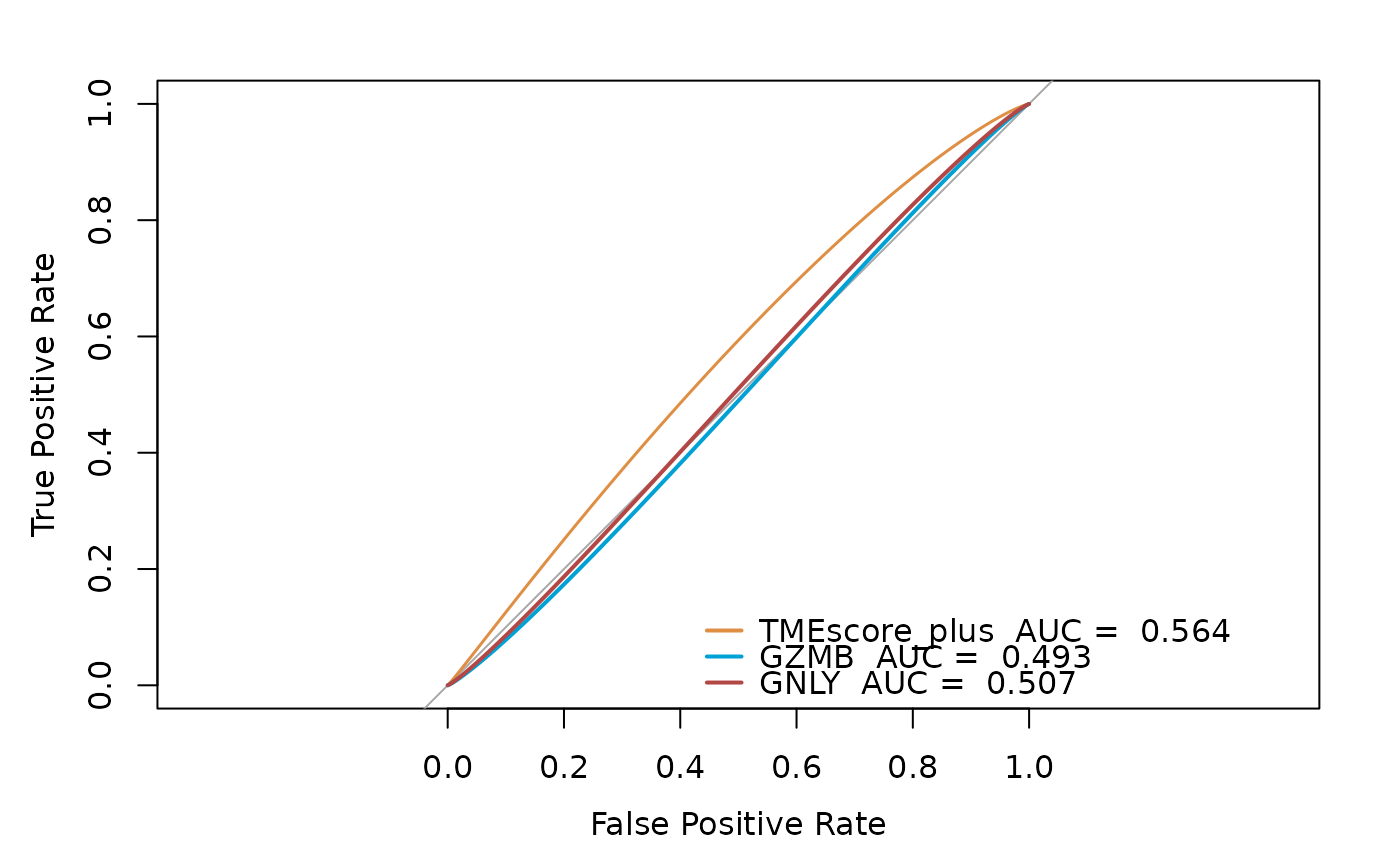
Generates Receiver Operating Characteristic (ROC) curves for multiple predictors and optionally performs statistical comparisons between them.
Usage
sig_roc(
  data,
  response,
  variables,
  fig.path = NULL,
  main = NULL,
  file.name = NULL,
  palette = "jama",
  cols = NULL,
  alpha = 1,
  compare = FALSE,
  smooth = TRUE,
  compare_method = "bootstrap",
  boot.n = 100
)
Arguments
- data
Data frame containing the predictor variables and binary outcome.
- response
Character. Name of the binary outcome variable in `data`.
- variables
Character vector. Names of predictor variables for ROC curves.
- fig.path
Character or `NULL`. Directory path to save output PDF. Default is `NULL`.
- main
Character or `NULL`. Main title for the ROC plot. Default is `NULL`.
- file.name
Character or `NULL`. Output PDF filename without extension. Default is `"0-ROC of multiple variables"`.
- palette
Character. Color palette for ROC curves. Default is `"jama"`.
- cols
Character vector or `NULL`. Custom colors for ROC curves. Default is `NULL`.
- alpha
Numeric. Transparency level (1 = opaque, 0 = transparent). Default is `1`.
- compare
Logical. Whether to perform statistical comparison of AUCs. Default is `FALSE`.
- smooth
Logical. Whether to smooth ROC curves. Default is `TRUE`.
- compare_method
Character. Method for comparing ROC curves. Default is `"bootstrap"`.
- boot.n
Integer. Number of bootstrap replications. Default is `100`.
Value
A list containing:
- auc.out
Data frame with AUC values and confidence intervals
- legend.name
Vector of legend entries for the plot
- p.out
If `compare = TRUE`, data frame with p-values from comparisons
Examples
set.seed(123)
test_data <- data.frame(
  OS_status = sample(c(0, 1), 20, replace = TRUE),
  Marker1 = rnorm(20),
  Marker2 = rnorm(20)
)
result <- sig_roc(data = test_data, response = "OS_status",
                  variables = c("Marker1", "Marker2"),
                  smooth = FALSE)
#> ℹ Input data preview:
#> Registered S3 method overwritten by 'pROC':
#>   method   from
#>   plot.roc spatstat.explore
#> Setting levels: control = 0, case = 1
#> Setting direction: controls > cases
#> Setting levels: control = 0, case = 1
#> Setting direction: controls < cases

if (!is.null(result)) print(result$auc.out)
#>             Name   AUC      AUC CI
#> auc.ci   Marker1 0.545 0.272-0.819
#> auc.ci.1 Marker2 0.475 0.202-0.747
if (!is.null(result)) print(result$auc.out)
#> Name AUC AUC CI
#> auc.ci Marker1 0.545 0.272-0.819
#> auc.ci.1 Marker2 0.475 0.202-0.747