Creates Kaplan-Meier survival plots for a given signature or gene, with automatic cutoff determination. Generates three types of plots: optimal cutoff (best cutoff), tertile-based (3 groups), and median split (2 groups).
Usage
sig_surv_plot(
  input_pdata,
  signature,
  project = "KM",
  ID = "ID",
  time = "time",
  status = "status",
  time_type = "month",
  break_month = "auto",
  cols = NULL,
  palette = "jama",
  show_col = TRUE,
  mini_sig = "score",
  fig.type = "png",
  save_path = NULL,
  index = 1
)
Arguments
- input_pdata
Data frame with survival data and signature scores.
- signature
Character string. Column name of the target signature.
- project
Character string. Project name for output. Default is `"KM"`.
- ID
Character string. Column name for sample IDs. Default is `"ID"`.
- time
Character string. Column name for survival time. Default is `"time"`.
- status
Character string. Column name for survival status. Default is `"status"`.
- time_type
Character string. Time unit (`"month"` or `"day"`). Default is `"month"`.
- break_month
Numeric or `"auto"`. Time axis breaks. Default is `"auto"`.
- cols
Character vector. Optional custom colors.
- palette
Character string. Color palette if `cols` not provided. Default is `"jama"`.
- show_col
Logical indicating whether to show colors. Default is `TRUE`.
- mini_sig
Character string. Label for low score group. Default is `"score"`.
- fig.type
Character string. File format. Default is `"png"`.
- save_path
Character string or `NULL`. Directory for saving plots. If `NULL`, plots are not saved. Default is `NULL`.
- index
Integer. Index for multiple plots. Default is `1`.
Value
A list containing:
- data
Processed input data with group assignments
- plots
Combined survival plots
Examples
# Create small example data
set.seed(123)
test_data <- data.frame(
time = runif(100, 0, 100),
OS_status = sample(c(0, 1), 100, replace = TRUE),
TMEscore_plus = rnorm(100),
ID = paste0("S", 1:100)
)
sig_surv_plot(
input_pdata = test_data,
signature = "TMEscore_plus",
time = "time",
status = "OS_status"
)
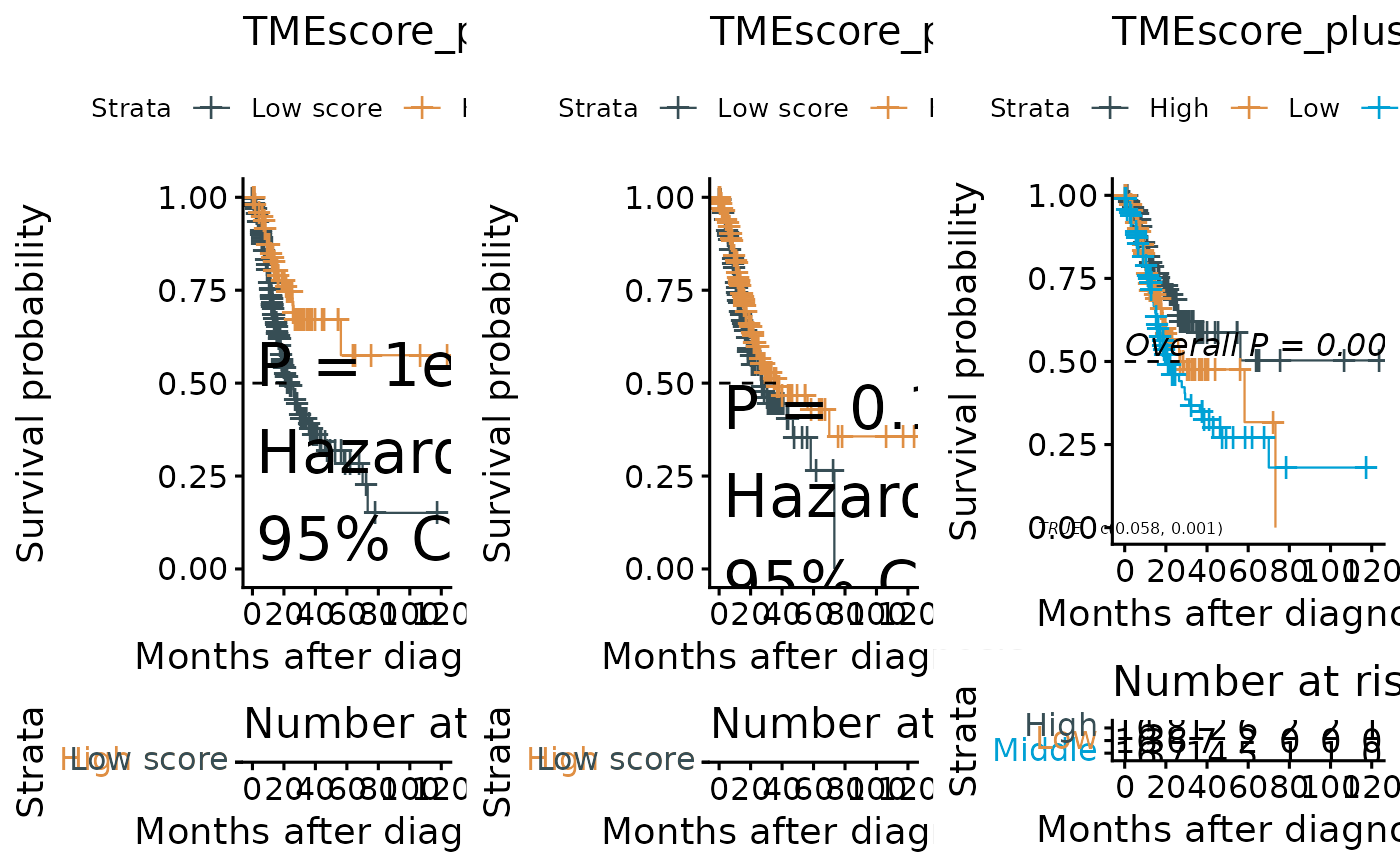
#> ℹ Survival follow-up time range: 0.06 to 99.43 months
#> ℹ Best cutoff for "TMEscore_plus": -1.01
#> ✔ Best cutoff for "TMEscore_plus": -1.008
#> ℹ High TMEscore_plus: 81
#> ℹ Low TMEscore_plus: 19
#> ℹ Maximum follow-up time is 99.4 months; divided into 6 sections
#> Ignoring unknown labels:
#> • colour : "Strata"
#> Ignoring unknown labels:
#> • colour : "Strata"
#> Ignoring unknown labels:
#> • colour : "Strata"
#> Ignoring unknown labels:
#> • colour : "Strata"
#> Ignoring unknown labels:
#> • colour : "Strata"
#> Ignoring unknown labels:
#> • colour : "Strata"
#> $data
#> time status TMEscore_plus ID group3 group2 bestcutoff
#> 1 28.75775201 0 -0.71040656 S1 Low Low High
#> 2 78.83051354 1 0.25688371 S2 High High High
#> 3 40.89769218 1 -0.24669188 S3 Middle Low High
#> 4 88.30174040 0 -0.34754260 S4 Middle Low High
#> 5 94.04672843 1 -0.95161857 S5 Low Low High
#> 6 4.55564994 1 -0.04502772 S6 Middle High High
#> 7 52.81054880 0 -0.78490447 S7 Low Low High
#> 8 89.24190444 0 -1.66794194 S8 Low Low Low
#> 9 55.14350145 0 -0.38022652 S9 Middle Low High
#> 10 45.66147353 1 0.91899661 S10 High High High
#> 11 95.68333453 1 -0.57534696 S11 Low Low High
#> 12 45.33341562 1 0.60796432 S12 High High High
#> 13 67.75706355 1 -1.61788271 S13 Low Low Low
#> 14 57.26334020 0 -0.05556197 S14 Middle High High
#> 15 10.29246827 0 0.51940720 S15 High High High
#> 16 89.98249704 1 0.30115336 S16 High High High
#> 17 24.60877344 1 0.10567619 S17 Middle High High
#> 18 4.20595335 1 -0.64070601 S18 Low Low High
#> 19 32.79207193 0 -0.84970435 S19 Low Low High
#> 20 95.45036491 1 -1.02412879 S20 Low Low Low
#> 21 88.95393161 0 0.11764660 S21 Middle High High
#> 22 69.28034062 1 -0.94747461 S22 Low Low High
#> 23 64.05068138 0 -0.49055744 S23 Middle Low High
#> 24 99.42697766 0 -0.25609219 S24 Middle Low High
#> 25 65.57057991 0 1.84386201 S25 High High High
#> 26 70.85304682 1 -0.65194990 S26 Low Low High
#> 27 54.40660247 1 0.23538657 S27 High High High
#> 28 59.41420204 0 0.07796085 S28 Middle High High
#> 29 28.91597373 0 -0.96185663 S29 Low Low High
#> 30 14.71136473 0 -0.07130809 S30 Middle High High
#> 31 96.30242325 1 1.44455086 S31 High High High
#> 32 90.22990451 0 0.45150405 S32 High High High
#> 33 69.07052784 1 0.04123292 S33 Middle High High
#> 34 79.54674177 1 -0.42249683 S34 Middle Low High
#> 35 2.46136845 1 -2.05324722 S35 Low Low Low
#> 36 47.77959711 1 1.13133721 S36 High High High
#> 37 75.84595375 1 -1.46064007 S37 Low Low Low
#> 38 21.64079358 1 0.73994751 S38 High High High
#> 39 31.81810076 1 1.90910357 S39 High High High
#> 40 23.16257854 0 -1.44389316 S40 Low Low Low
#> 41 14.28000224 1 0.70178434 S41 High High High
#> 42 41.45463358 1 -0.26219749 S42 Middle Low High
#> 43 41.37243263 1 -1.57214416 S43 Low Low Low
#> 44 36.88454509 0 -1.51466765 S44 Low Low Low
#> 45 15.24447477 1 -1.60153617 S45 Low Low Low
#> 46 13.88060634 1 -0.53090652 S46 Low Low High
#> 47 23.30340995 1 -1.46175558 S47 Low Low Low
#> 48 46.59624503 0 0.68791677 S48 High High High
#> 49 26.59726404 1 2.10010894 S49 High High High
#> 50 85.78277153 1 -1.28703048 S50 Low Low Low
#> 51 4.58311667 0 0.78773885 S51 High High High
#> 52 44.22000742 1 0.76904224 S52 High High High
#> 53 79.89248456 0 0.33220258 S53 High High High
#> 54 12.18992600 1 -1.00837661 S54 Low Low Low
#> 55 56.09479838 0 -0.11945261 S55 Middle Low High
#> 56 20.65313896 0 -0.28039534 S56 Middle Low High
#> 57 12.75316502 0 0.56298953 S57 High High High
#> 58 75.33078643 0 -0.37243876 S58 Middle Low High
#> 59 89.50453592 0 0.97697339 S59 High High High
#> 60 37.44627759 0 -0.37458086 S60 Middle Low High
#> 61 66.51151946 0 1.05271147 S61 High High High
#> 62 9.48406609 1 -1.04917701 S62 Low Low Low
#> 63 38.39696378 1 -1.26015524 S63 Low Low Low
#> 64 27.43836446 1 3.24103993 S64 High High High
#> 65 81.46400389 0 -0.41685759 S65 Middle Low High
#> 66 44.85163414 1 0.29822759 S66 High High High
#> 67 81.00643530 0 0.63656967 S67 High High High
#> 68 81.23895095 0 -0.48378063 S68 Middle Low High
#> 69 79.43423211 1 0.51686204 S69 High High High
#> 70 43.98316876 0 0.36896453 S70 High High High
#> 71 75.44751586 1 -0.21538051 S71 Middle Low High
#> 72 62.92211316 1 0.06529303 S72 Middle High High
#> 73 71.01824014 1 -0.03406725 S73 Middle High High
#> 74 0.06247733 1 2.12845190 S74 High High High
#> 75 47.53165741 0 -0.74133610 S75 Low Low High
#> 76 22.01188852 0 -1.09599627 S76 Low Low Low
#> 77 37.98165377 0 0.03778840 S77 Middle High High
#> 78 61.27710033 1 0.31048075 S78 High High High
#> 79 35.17979092 1 0.43652348 S79 High High High
#> 80 11.11354243 1 -0.45836533 S80 Middle Low High
#> 81 24.36194727 1 -1.06332613 S81 Low Low Low
#> 82 66.80555874 0 1.26318518 S82 High High High
#> 83 41.76467797 0 -0.34965039 S83 Middle Low High
#> 84 78.81958340 0 -0.86551286 S84 Low Low High
#> 85 10.28646443 0 -0.23627957 S85 Middle Low High
#> 86 43.48927415 1 -0.19717589 S86 Middle Low High
#> 87 98.49569800 1 1.10992029 S87 High High High
#> 88 89.30511144 0 0.08473729 S88 Middle High High
#> 89 88.64690608 0 0.75405379 S89 High High High
#> 90 17.50526503 1 -0.49929202 S90 Low Low High
#> 91 13.06956916 1 0.21444531 S91 Middle High High
#> 92 65.31019250 0 -0.32468591 S92 Middle Low High
#> 93 34.35164723 0 0.09458353 S93 Middle High High
#> 94 65.67581280 1 -0.89536336 S94 Low Low High
#> 95 32.03732425 1 -1.31080153 S95 Low Low Low
#> 96 18.76911193 0 1.99721338 S96 High High High
#> 97 78.22943013 0 0.60070882 S97 High High High
#> 98 9.35949867 1 -1.25127136 S98 Low Low Low
#> 99 46.67790416 0 -0.61116592 S99 Low Low High
#> 100 51.15054599 1 -1.18548008 S100 Low Low Low
#>
#> $plots
 #>
#>