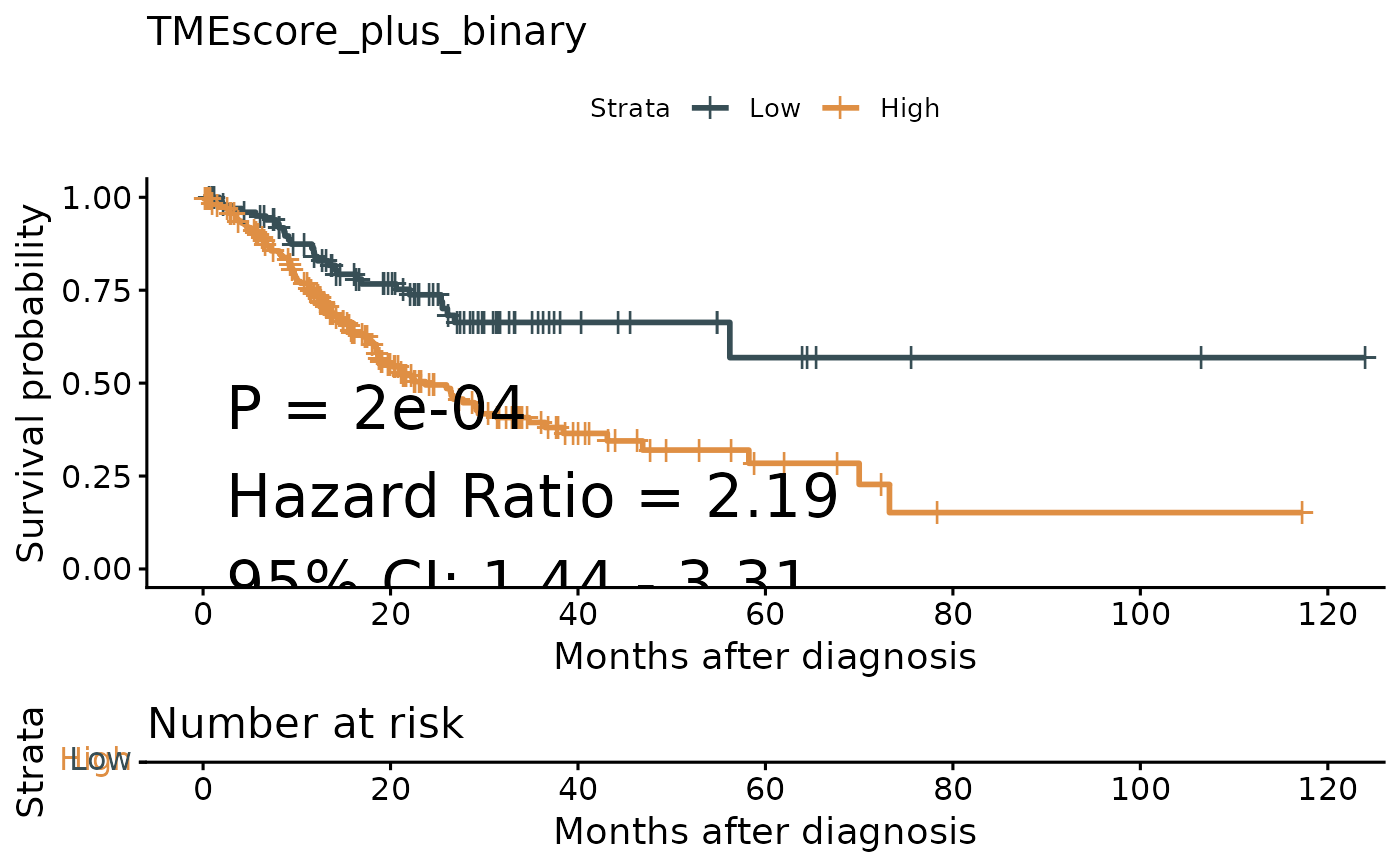
Creates Kaplan-Meier survival plots for data grouped by a categorical variable. Handles both binary and multi-level categorical groups with customizable plot aesthetics.
Usage
surv_group(
  input_pdata,
  target_group,
  ID = "ID",
  levels = c("High", "Low"),
  reference_group = NULL,
  project = NULL,
  time = "time",
  status = "status",
  time_type = "month",
  break_month = "auto",
  cols = NULL,
  palette = "jama",
  mini_sig = "score",
  save_path = NULL,
  fig.type = "pdf",
  index = 1,
  width = 6,
  height = 6.5,
  font.size.table = 3
)
Arguments
- input_pdata
Data frame containing survival data and grouping variables.
- target_group
Name of column containing the grouping variable.
- ID
Name of column with unique identifiers. Default is "ID".
- levels
Names for levels of target_group (for binary groups). Default is c("High", "Low").
- reference_group
Reference level for binary comparison. Default is NULL.
- project
Optional title for plot. Default is NULL.
- time
Name of column with follow-up times. Default is "time".
- status
Name of column with event indicators. Default is "status".
- time_type
Units: "month" or "day". Default is "month".
- break_month
X-axis break interval. If "auto", calculated automatically. Default is "auto".
- cols
Color vector for plot lines. Default is NULL.
- palette
Color palette name. Default is "jama".
- mini_sig
Prefix label for variables. Default is "score".
- save_path
Directory for saving plot. Default is NULL.
- fig.type
File format: "pdf" or "png". Default is "pdf".
- index
Identifier for file naming. Default is 1.
- width
Plot width. Default is 6.
- height
Plot height. Default is 6.5.
- font.size.table
Font size for risk table. Default is 3.
Examples
# Simulate data
set.seed(123)
sim_pdata <- data.frame(
  ID = paste0("Sample", 1:100),
  Lauren = sample(c("Intestinal", "Diffuse"), 100, replace = TRUE),
  time = runif(100, 1, 60),
  OS_status = sample(0:1, 100, replace = TRUE)
)
# Run survival analysis (survival and survminer are imported packages)
result <- surv_group(
  input_pdata = sim_pdata,
  target_group = "Lauren",
  time = "time",
  status = "OS_status",
  save_path = NULL
)
#> ℹ Follow-up time ranges from 1.62 to 59.15 months
#>    Diffuse Intestinal
#>         43         57
#> ℹ Maximum follow-up time is 59.2 months; divided into 6 sections
#> ℹ Reference group not defined, using alphabetical order
#> Ignoring unknown labels:
#> • colour : "Strata"
if (!is.null(result)) print(result)

#> [[1]]
#> NULL
#>
#> [[1]]
#> NULL
#>