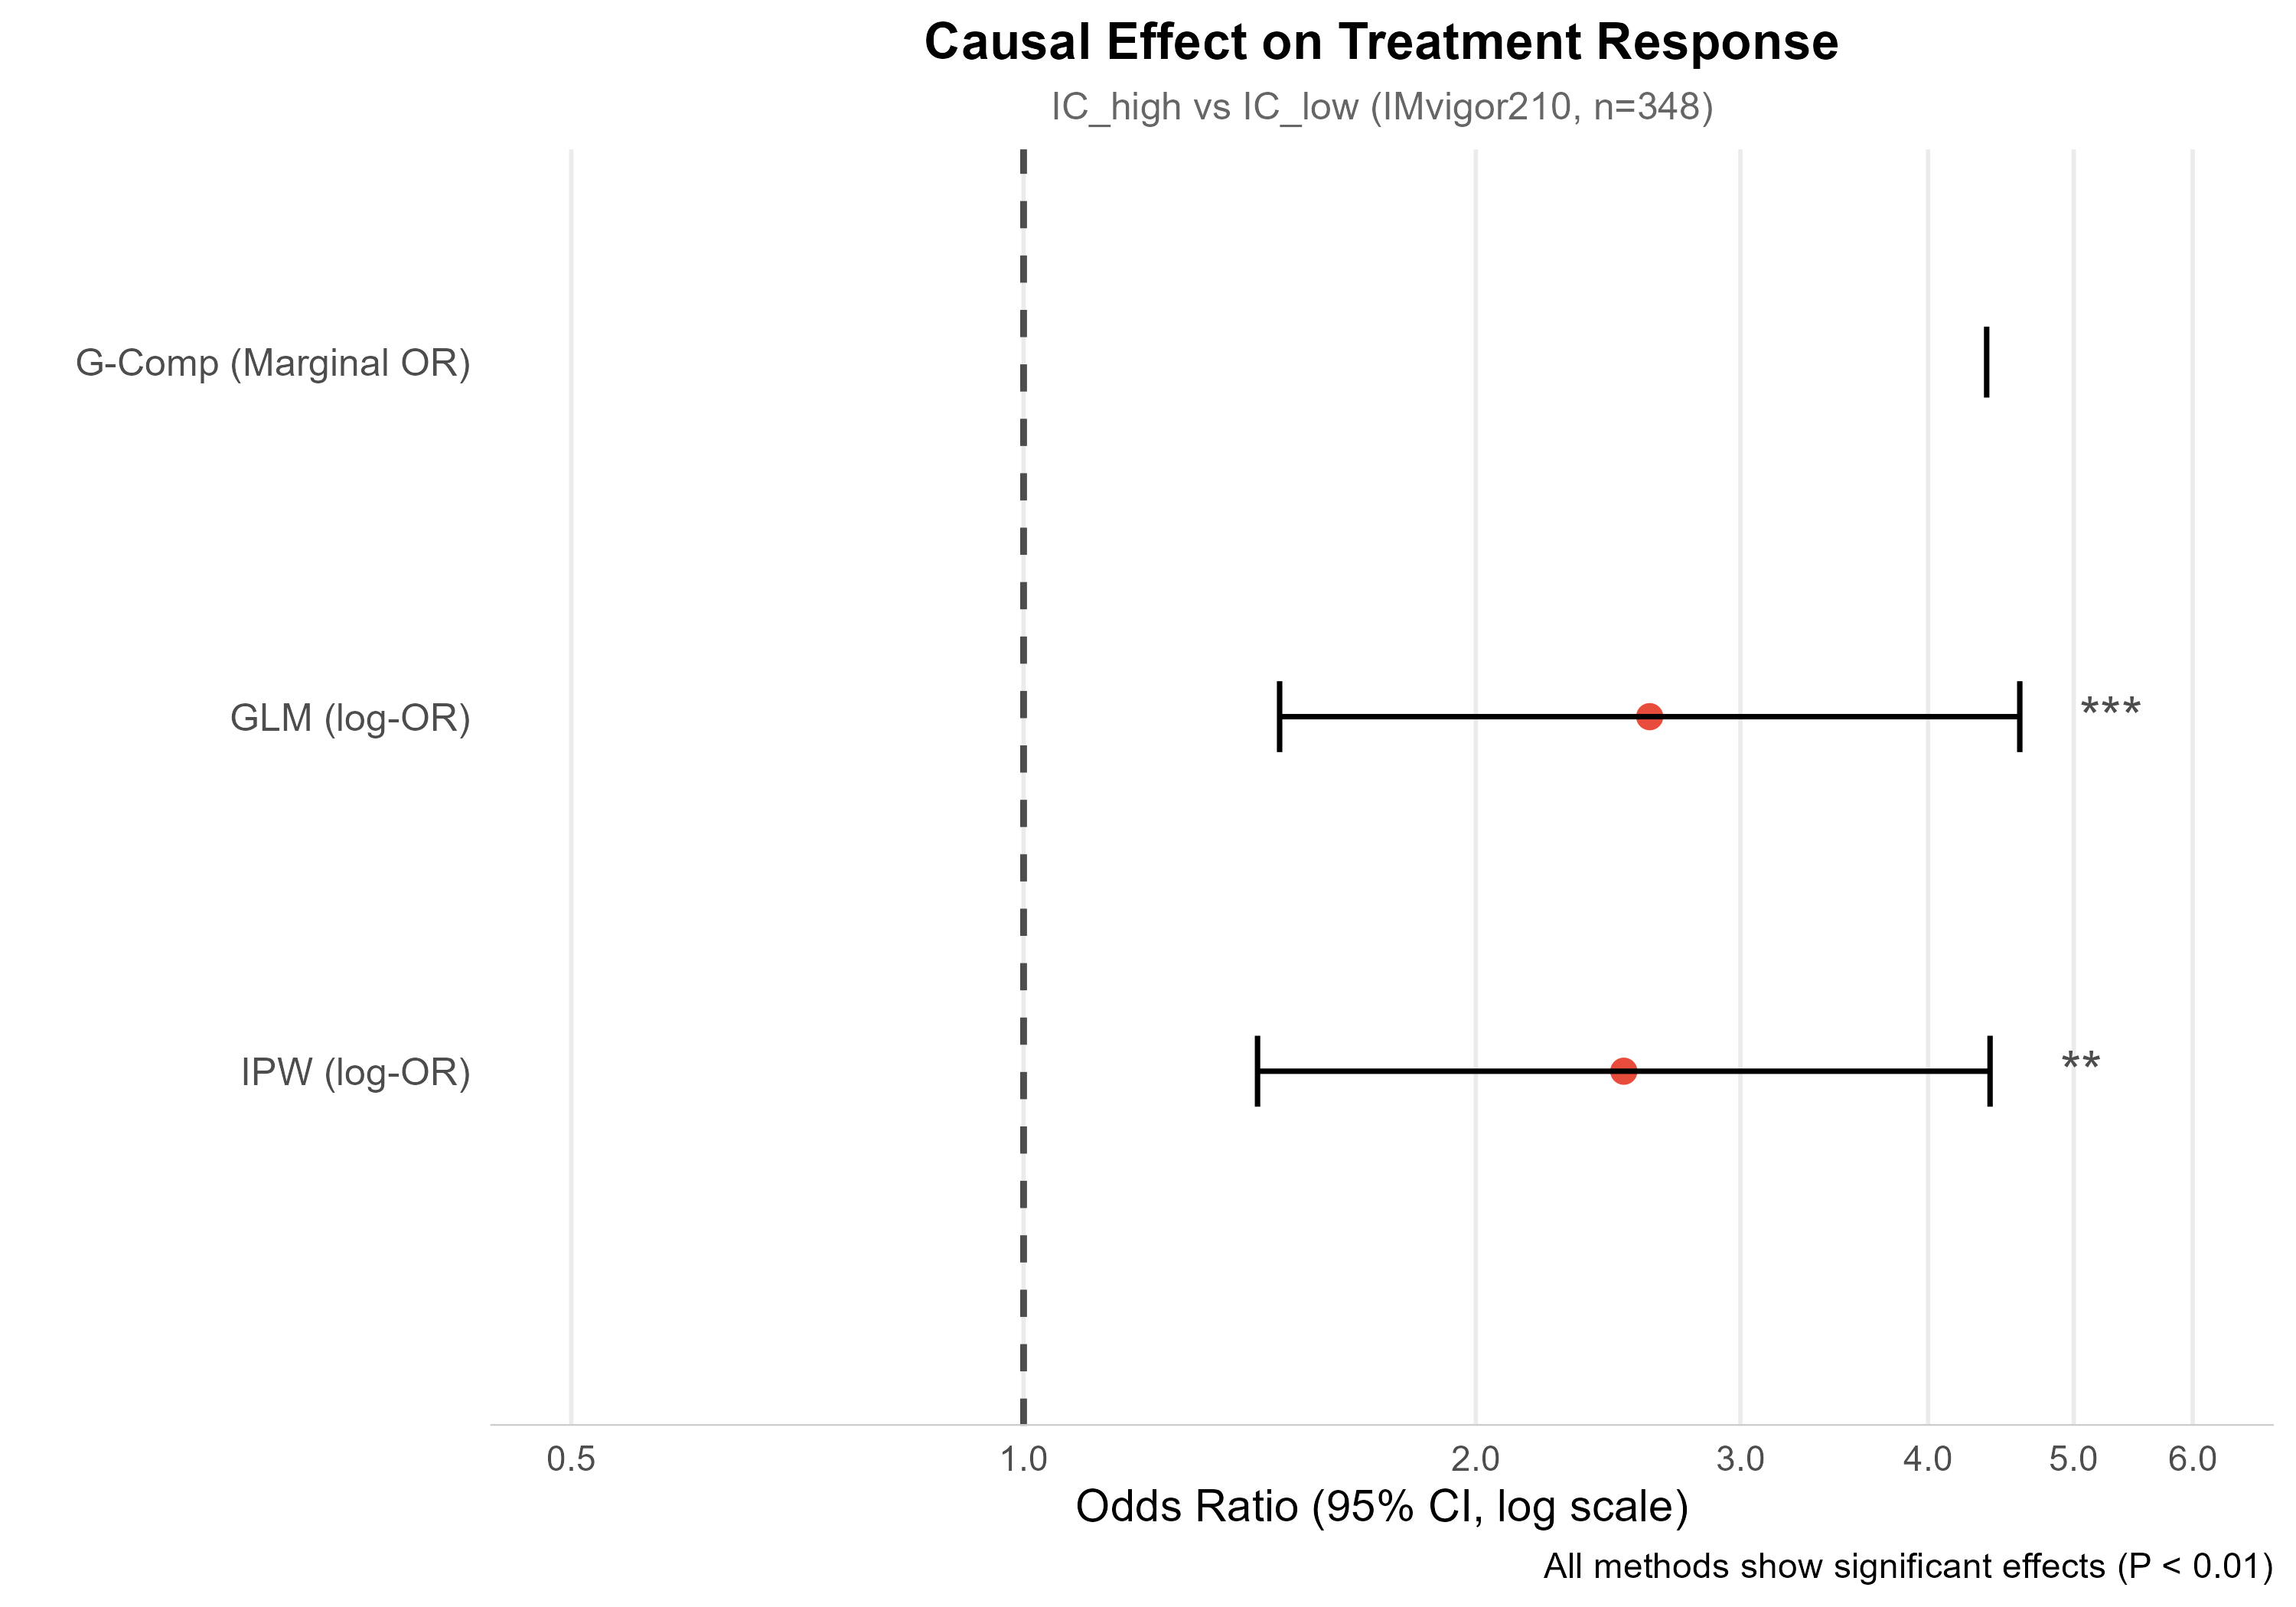
Appendix A — Original examples and figures
The original README included the following numeric illustration for a simulated 100-subject example. These values are retained as historical context for the original figures. They have not been rerun or revalidated for 32.2.3 and are not expected outputs of the Book examples.
| Characteristic | Historical value |
|---|---|
| Sample size | 100 |
| Group labeled IC_high | 50 |
| Response rate | 48% |
| Mean age | 64.7 years |
| Male proportion | 53% |
| Method | Historical effect | 95% CI | P value |
|---|---|---|---|
| GLM | OR 3.87 | 1.67 to 9.00 | 0.002 |
| AIPW | RD 0.32 | 0.11 to 0.52 | 0.002 |
| IPW | OR 3.74 | 1.60 to 8.74 | 0.002 |
| GComp | RD 0.32 | 0.13 to 0.49 | 0.005 |
The earlier clinical illustration also displayed HR 0.94 and P 0.79. These survival values belong to that historical illustration, not to the installation check or a new clinical analysis.
Reusing an old analysis
Recover the original input, codebook, cohort, settings and saved result before making scientific use of an old figure. A label such as IC_high does not by itself establish whether the underlying variable was TMB, immune-cell PD-L1 or another score. Do not infer its meaning from the filename or plot label.
The old IMvigor210 section mixed a data-dependent example with hard-coded output numbers. The current method chapters show actual result-column extraction instead. In particular, old AIPW values labeled OR must not be relabeled RD without the original valid result. The Book does not assert a newly reproduced IMvigor210 result.
All six original PNG files are copied byte-for-byte for the Book. The additional corrected forest asset remains available; the five original homepage images retain their order on GitHub.